


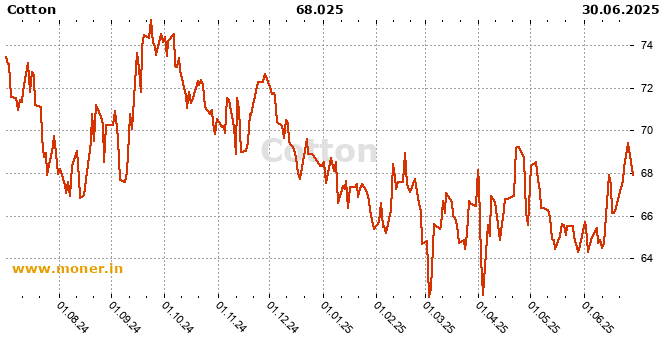
Cotton, Commodities history
Cotton history chart, last update June 15, 2026
Cotton onlineLoading....
Last 15 days history
| Date | Middle |
| June 15, 2026 | 75.050000 |
| June 12, 2026 | 76.500000 |
| June 11, 2026 | 76.310000 |
| June 10, 2026 | 73.125000 |
| June 9, 2026 | 73.385000 |
| June 8, 2026 | 75.340000 |
| June 5, 2026 | 73.600000 |
| June 4, 2026 | 74.870000 |
| June 3, 2026 | 76.500000 |
| June 2, 2026 | 76.990000 |
| June 1, 2026 | 76.635000 |
| May 29, 2026 | 76.015000 |
| May 28, 2026 | 76.740000 |
| May 27, 2026 | 76.170000 |
| May 26, 2026 | 77.385000 |
Cotton history chart
Time: June 17, 2026, 10:31 a.m.
| London time: | June 17, 2026, 2:31 a.m. |
| NY time: | June 16, 2026, 9:31 p.m. |
| Tokyo time: | June 17, 2026, 10:31 a.m. |