


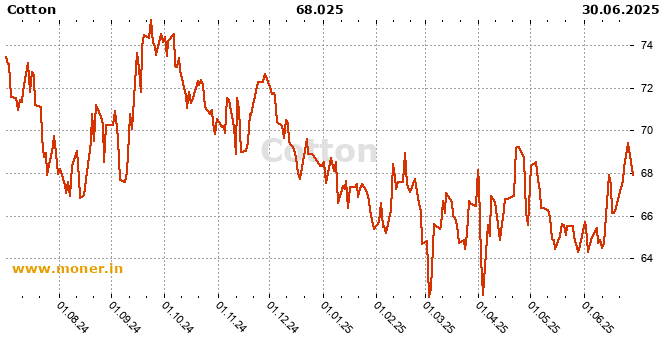
Cotton, Commodities history
Cotton history chart, last update June 27, 2025
Cotton onlineLoading....
Last 15 days history
| Date | Middle |
| June 27, 2025 | 69.305000 |
| June 26, 2025 | 68.775000 |
| June 25, 2025 | 68.295000 |
| June 24, 2025 | 67.795000 |
| June 23, 2025 | 67.535000 |
| June 20, 2025 | 66.755000 |
| June 19, 2025 | 66.560000 |
| June 18, 2025 | 66.560000 |
| June 17, 2025 | 67.655000 |
| June 16, 2025 | 68.035000 |
| June 13, 2025 | 65.390000 |
| June 12, 2025 | 65.180000 |
| June 11, 2025 | 65.510000 |
| June 10, 2025 | 65.390000 |
| June 9, 2025 | 65.980000 |
Cotton history chart
Time: July 1, 2025, 5:27 p.m.
| London time: | July 1, 2025, 9:27 a.m. |
| NY time: | July 1, 2025, 4:27 a.m. |
| Tokyo time: | July 1, 2025, 5:27 p.m. |