


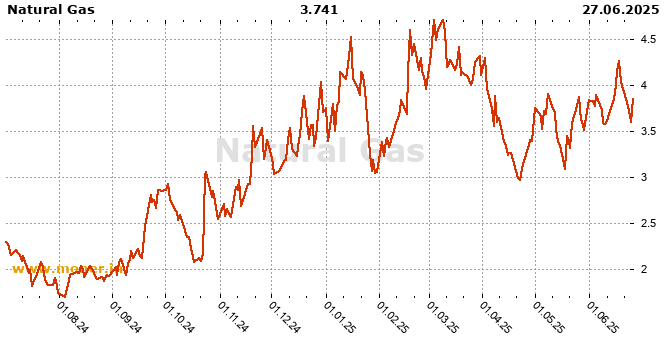
Natural Gas, Commodities history
Natural Gas history chart, last update Jan. 13, 2026
Natural Gas onlineLoading....
Last 15 days history
| Date | Middle |
| Jan. 13, 2026 | 3.412500 |
| Jan. 12, 2026 | 3.383500 |
| Jan. 9, 2026 | 3.143500 |
| Jan. 8, 2026 | 3.402000 |
| Jan. 7, 2026 | 3.565500 |
| Jan. 6, 2026 | 3.400300 |
| Jan. 5, 2026 | 3.512000 |
| Jan. 2, 2026 | 3.640000 |
| Dec. 31, 2025 | 3.708000 |
| Dec. 30, 2025 | 3.957500 |
| Dec. 29, 2025 | 3.945500 |
| Dec. 26, 2025 | 3.866300 |
| Dec. 24, 2025 | 3.767500 |
| Dec. 23, 2025 | 4.166300 |
| Dec. 22, 2025 | 3.786500 |
Natural Gas history chart
Time: Jan. 15, 2026, 2:39 p.m.
| London time: | Jan. 15, 2026, 5:39 a.m. |
| NY time: | Jan. 15, 2026, 12:39 a.m. |
| Tokyo time: | Jan. 15, 2026, 2:39 p.m. |